Remove demographics native-americans
article thumbnail

Report Finds That Affirmative Action Only Led to Incremental Progress

Diverse: Issues in Higher Education

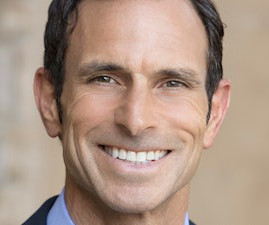
Jeff Strohl, director of CEW and lead author of “ Progress Interrupted: Evaluating a Decade of Demographic Change at Selective and Open-Access Institutions Prior to the End of Race-Conscious Affirmative Action.” Hispanic/Latino enrollment almost doubled Hispanic/Latino, increasing by about 50,000, at selective institutions from 2009 to 2019.

Access 262
article thumbnail

A Snapshot of Today’s College Students

IHEP Institute for Higher Education Policy

These data show that students who identify as Black, Hispanic or Latino, Asian American, Native Hawaiian or Pacific Islander, or American Indian or Alaska Native make up the majority (52 percent) of undergraduate enrollment. NPSAS provides information on students’ self-reported race and ethnicity, across six categories.

Students 217
professionals

Sign Up for our Newsletter

This site is protected by reCAPTCHA and the Google Privacy Policy and Terms of Service apply.

article thumbnail

First-Time Graduate Enrollment Rises, But Declines Domestically

Diverse: Issues in Higher Education

Several racial demographics domestically – including underrepresented minorities (URM) – saw declines, with first-time graduate enrollment falling 5.7% for American Indian/Alaska Native students, 4.1% for Black/African American students, and 0.9% among Black/African Americans, 0.9% for white students, 4.5%

article thumbnail

How Data Drives Student Success

Diverse: Issues in Higher Education

LaGuardia is an MSI twice over — it meets the minimum demographic thresholds to qualify as a Hispanic Serving Institution (HSI) and an Asian American Native American Pacific Islander Serving Institution (AANAPISI). Forty-four percent of undergraduate enrollment is Latinx, and 20% is Asian American.

article thumbnail

Report: More Women and Communities of Color in STEM Than in Past Years

Diverse: Issues in Higher Education

To note, despite the increases for the aforementioned demographics, these groups – and those with disabilities – remain underrepresented in STEM compared to their percentage in the U.S. And although Hispanic, Black, American Indian, and Alaska Native people comprise 31% of the population, they comprise only 24% of the 2021 STEM workforce.

article thumbnail

Report: Graduate Enrollment is on the Decline

Diverse: Issues in Higher Education

Fall 2022 enrollment for students from underrepresented demographics also saw lower numbers, with Black/African American students experiencing the worst of it with a 7.8% decline and American Indian/Alaska Native students saw one of 1.6%. "We Latinx students saw a 5.7%

article thumbnail

Report: National Six-Year College Completion Rates Stalling

Diverse: Issues in Higher Education

Similar stagnation was discernable for various racial and ethnic demographics. to 43.4% – and Native American students faced the largest decrease of the period, 2%, from 49.5% Georgia, Florida, New York, and Massachusetts were some of the states that instead saw declining six-year completion rates. Black students saw a 0.5%

Students 264